
In the dynamic world of software development, effective team performance measurement is crucial. While DORA metrics have become a standard, my experience suggests a different starting point might yield more meaningful insights.
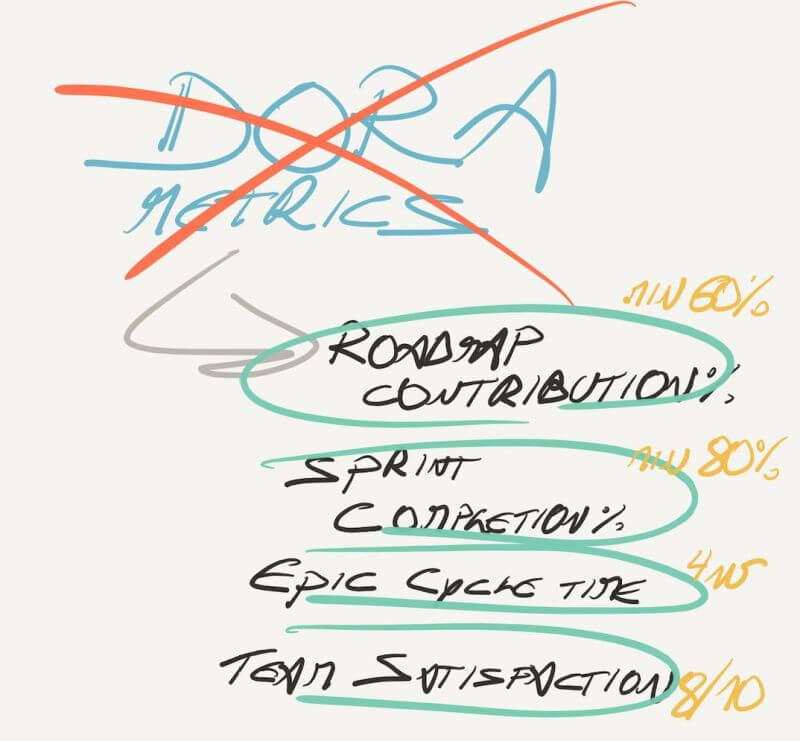
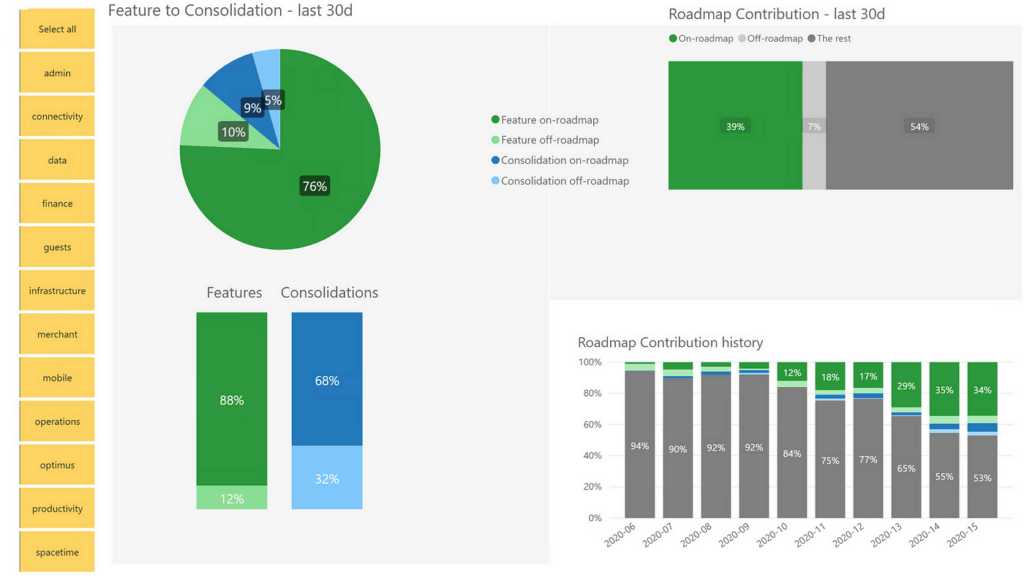
1. Roadmap Contribution: Aligning Efforts with Objectives
The amount of time your team spends on key roadmap items is critical. A 50-80% threshold ensures efforts align with overarching goals. This balance ensures that high performance contributes directly to success, rather than just busy work.
?What’s the purpose of having expensive highly performing teams if they don’t work on things that matter the most, having 60% off-roadmap contribution?
2. Sprint Completion: A Measure of Trust and Efficiency
Sprint completion rates, ideally above 80%, reflect how well the team plans and executes. A lower rate often signals underlying trust issues, impacting overall productivity and morale.
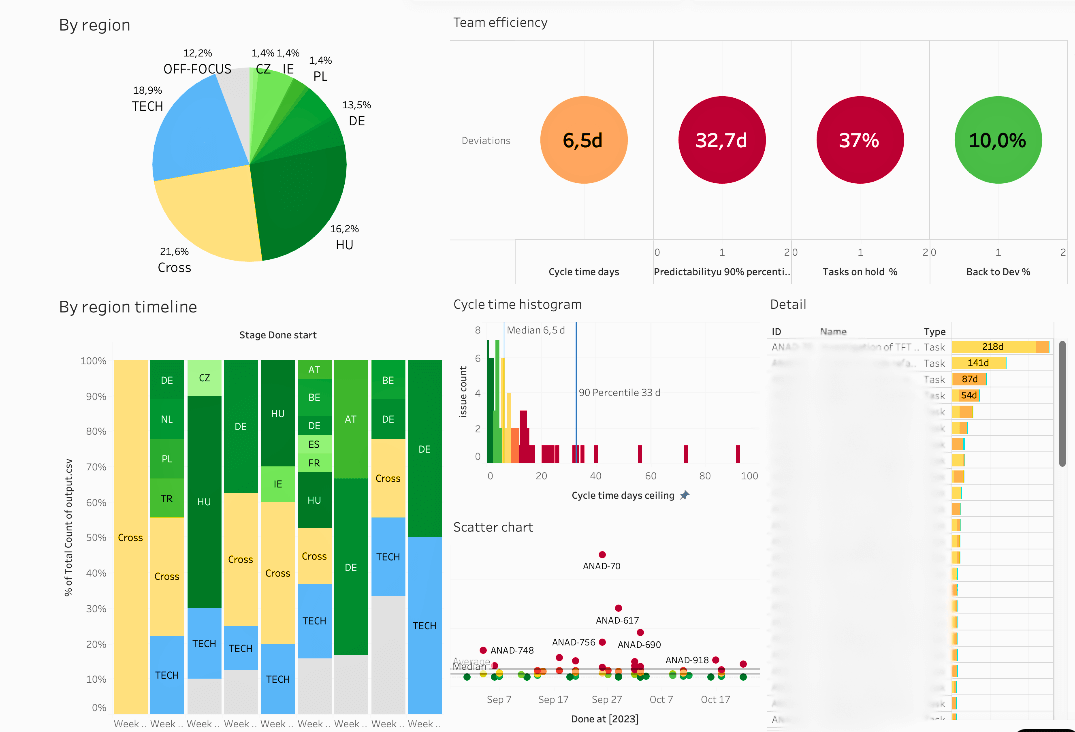
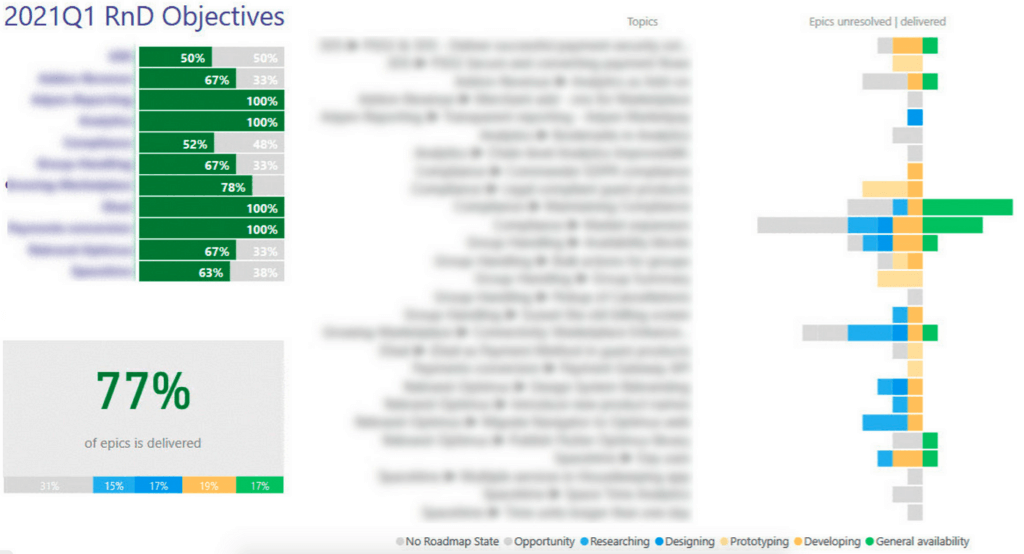
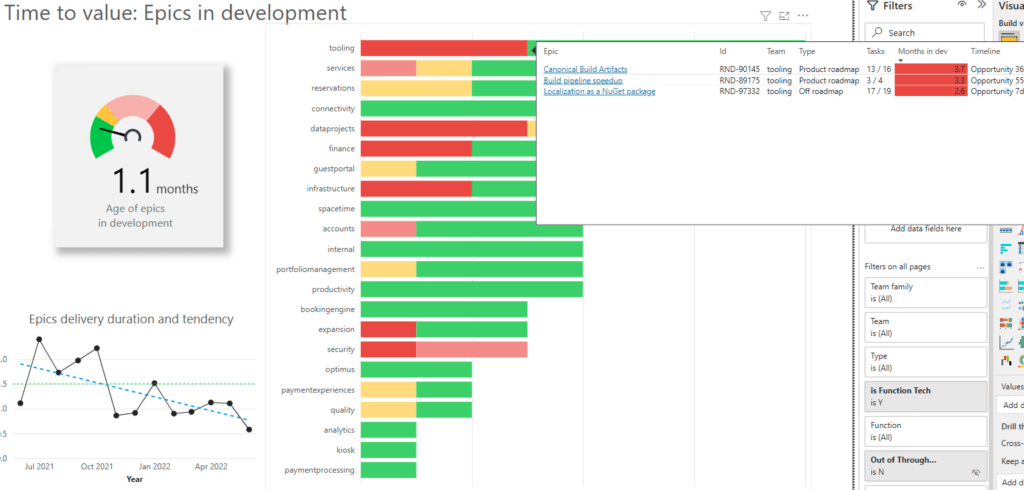
3. Epic Cycle Time: The Real Value Indicator
Forget traditional task cycle times and Jira burndown charts. Focus on Epic Cycle Time, with a median target of 4-5 weeks. This metric is a truer representation of the team’s ability to deliver tangible value to customers.
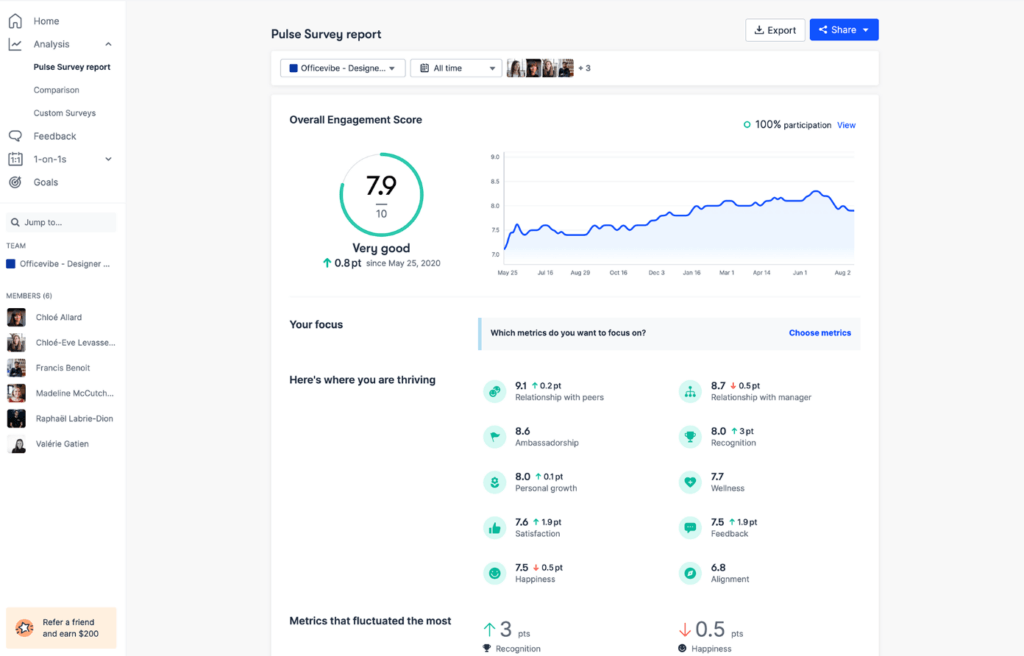
4. Team Satisfaction: The Heartbeat of Your Team
A continuous survey with a scale of 0-10, aiming for around 8, reveals the team’s health. A sudden drop is a red flag, allowing leaders to proactively address potential issues.
It’s a huge money-saver, preventing the team destabilisation.
5. Adoption RATE
Measure how many increments have been successfully accepted and adopted by your customer. Threshold: min 65%.
Conclusion: A Broader Perspective on Team Metrics
Starting with these metrics provides a broader view of your team’s effectiveness. It shifts the focus from code-centric metrics to a more holistic view of team dynamics, output, and satisfaction.
Closing
if you’re wondering where to start, there’s a free open-source Jira data extraction tool available, with all data required: https://github.com/marian-kamenistak/jira-lead-cycle-time-duration-extractor
Mission
The more we help to raise first-time engineering managers in our ?? territory, the faster we elevate local companies and the talent ?, getting us on par with software citadels like Berlin ?? or London ??.
About Marian Kamenistak
Marian provides coaching and mentoring to engineering managers and leaders across various levels, helping organisations to succeed in building products.
Stay tuned for the next post! ?